Passage Graph

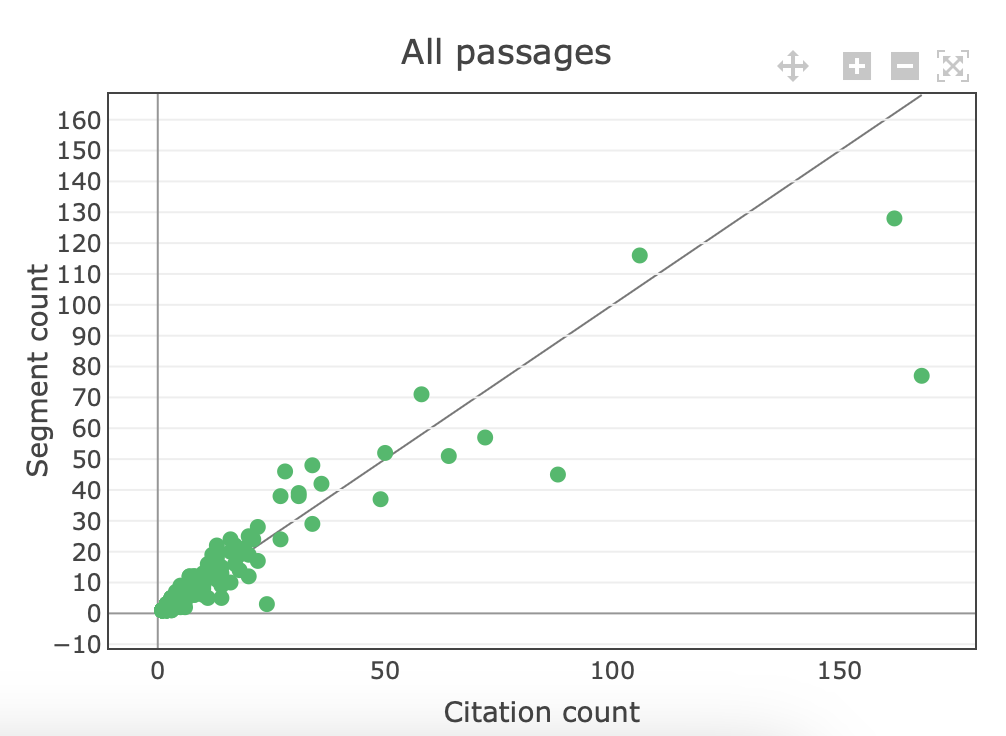
Figure: A screenshot of the passage graph.
The passage graph can be accessed by clicking on the icon in the
Navigation Bar.
The passage graph shows each passage as a green circle. The location in the graph is determined by the citation count (x-axis) and segment count (y-axis). More details on the terminology can be found here. Hovering over a circle shows the first and last few words of the passage. By clicking on a circle, the literary text is scrolled to that passage.
Tip
This graph can be useful for identifying passages which could be of interest. For example, passages which combine a high citation count with a relatively lower segment count, that is, passages below the diagonal line, are likely to be evenly quoted.