Quotations Over Time

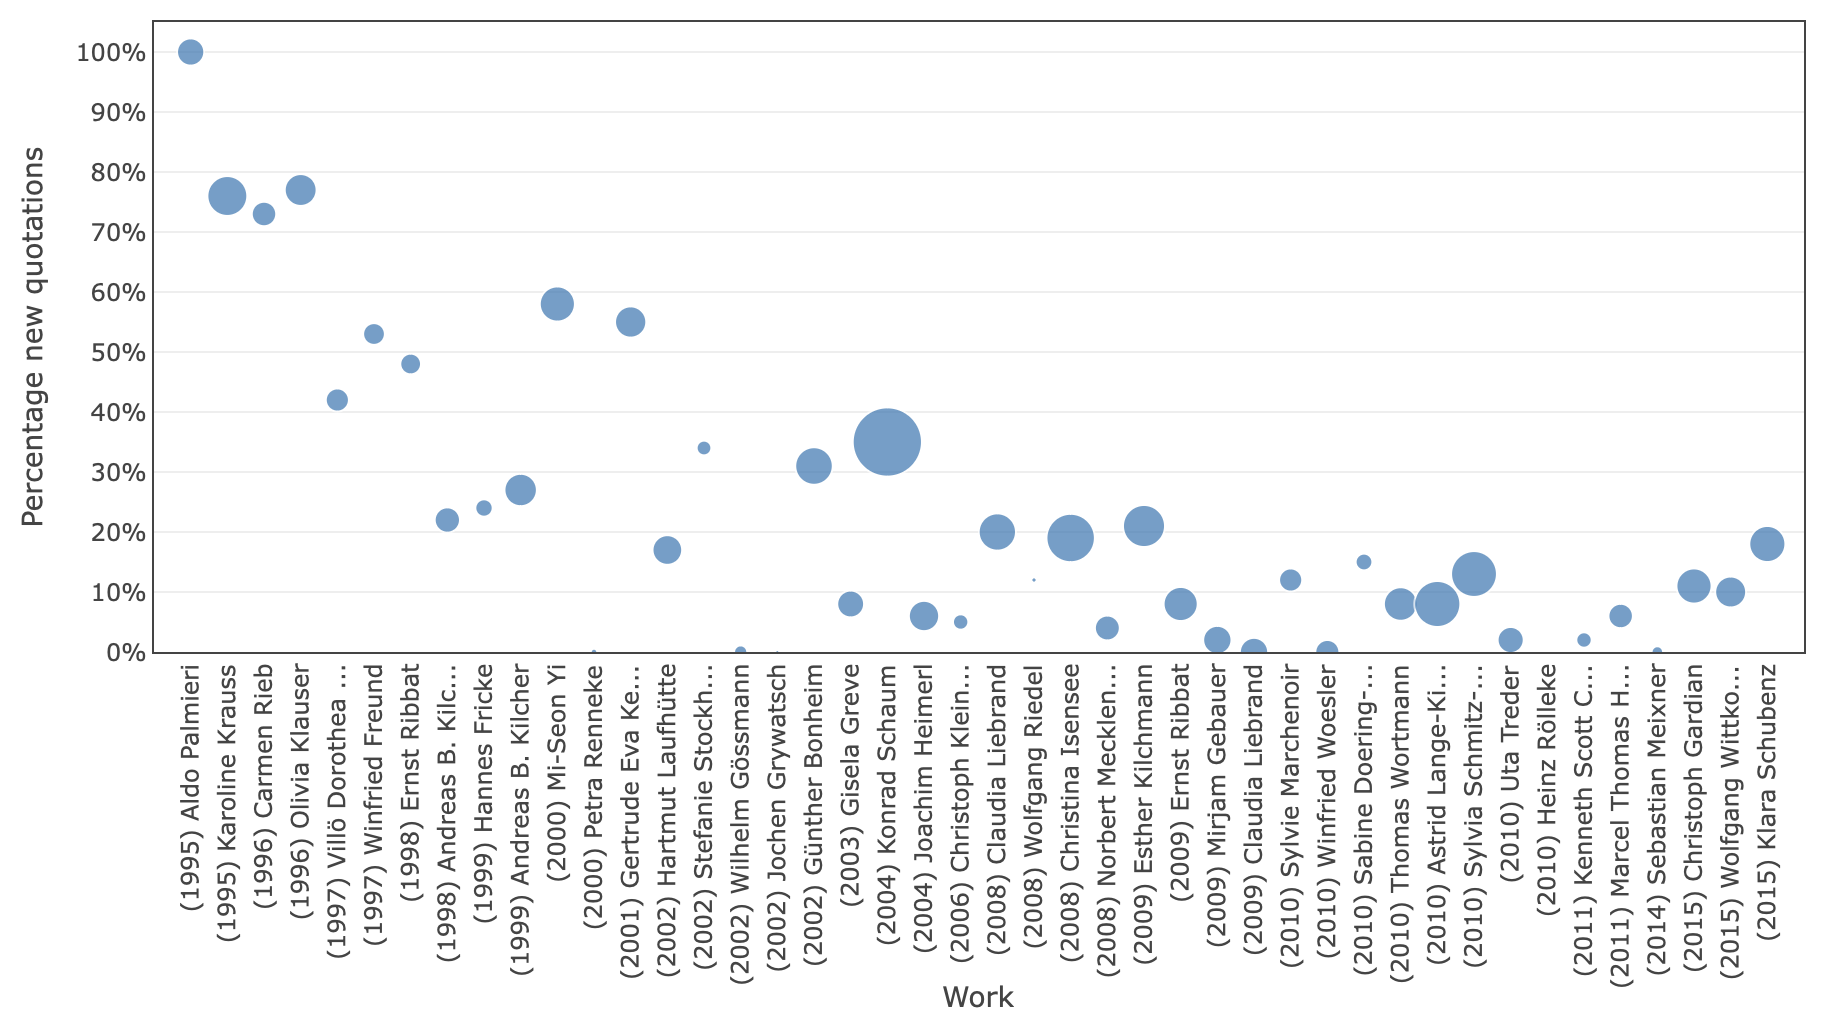
Figure: A screenshot of the quotations over time graph.
This graph can be accessed by clicking on the icon in the
Navigation Bar.
The horizontal axis shows the scholarly works by year and the vertical axis the percentage of new quotations compared to all previous scholarly works. The oldest scholarly work will always have 100 % new quotations. The size of the circle gives an indication of the number of quotations of that scholarly work. Hovering over a circle reveals more information on the scholarly work, including the name and exact number of quotations.