Welcome
Earth Observation is an advanced remote sensing course for students of the Master of Science “Global Change Geography” of Humboldt-Universität zu Berlin. In this course, we cover aspects of optical remote sensing of land surfaces, using multispectral Landsat and Sentinel 2 imagery. The course is based on open source software.
Requirements
A good understanding of basic principles of remote sensing is required to follow this course. This includes:
- knowledge about operational optical sensor systems
- common sensor properties such as spatial, temporal, spectral and radiometric resolution
- the electromagnetic spectrum and relevant wavelengths in optical remote sensing
- reflectance properties of different land surface types
- good knowledge of at least one GIS and remote sensing software packages
Participants should furthermore have a basic understanding of R, including syntax, data types and knowledge on how to read, manipulate and write data. As you have followed the curriculum of the MSc program, you most likely joined module “M1 - Quantitative Methods for Geographers”, in which you learned using R for statistical problems. We here build on these basics. If you are not confident in using R, please follow one of the numerous tutorials listed in the chapter on “R Basics”.
Learning goals & course contents
The main goal of this course is to provide you with the necessary knowledge and tools for using optical remote sensing datasets and methods in the geo-scientific context. We want you to enhance your ability of problem-solving, empowering you to perform research independently. The course contents are related to our lab´s research foci, both in terms of methods and study regions. You may want to check out our publications, current projects, or have a look at some of our published data and webmaps.
In the course you will learn about current state-of-the-art methods in image processing and time series analyses of optical satellite imagery. The course covers methods related to data quality, cloud masking, vegetation indices, multi-temporal image analyses, machine learning based classification and regression, area adjusted accuracy assessment, time series analyses, and image compositing. We use these methods for mapping of land surface components, dynamics and structures in the Carpathian ecoregion in Poland, the Southern Brazilian Amazon and Western Canadian Arctic.
Towards the end of the course you will apply your gained knowledge to conduct research projects close to our current research in the EO-lab. The overall goal is to strengthen your competence in problem-solving and to increase your confidence in working with remote sensing and other geospatial datasets. Based on the analyses, you will write a research paper with focus on the methodological and the application related aspects within the broader framing of global change and remote sensing in the respective case studies.
Why R?
R is a programming language and open source software environment for statistical computing and graphics. The R language is widely used among statisticians and data miners for developing statistical software and data analysis. It was developed by Ross Ihaka and Robert Gentleman at the University of Auckland, New Zealand. The name R originates the first names of the two authors and refers to the programming language S. The project was conceived in 1992, with an initial version released in 1995 and a stable beta version in 2000.
Learning R has tons of advantages. It is a great starting point for
those eager to learn programming. R offers increasingly specialized
tools for data wrangling, statistical analyses, and visualization. The
CRAN package repository currently features >13,000 packages serving a
variety of purposes, e.g. data manipulation (tidyr,
dplyr, caret), visualization
(ggplot2, ggmap, rasterVis), and
geodata handling (raster, rgdal,
sp, sf). You will notice that a huge share of
figures in scientific publications was produced using R. The R community
is huge, and offers great support. R is extremely popular in science
& industry, so a proficiency in R opens a wide array of job
opportunities. Everything is free and open source.
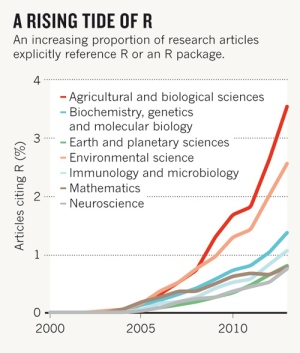
A rising tide for R (Tipman 2015; doi: 10.1038/517109a)
Copyright © 2020 Humboldt-Universität zu Berlin. Department of Geography.
![]()