- Learning goals
- Sentinel-2 and Landsat
- Data providers
Data acquisition from ESA and NASA/USGS
Learning goals
- Accessing and downloading freely available multispectral data by …
- … getting to know ESA’s Copernicus Open Access Hub and USGS’ EarthExplorer, and …
- … searching for Sentinel-2 and Landsat data.
Sentinel-2 and Landsat
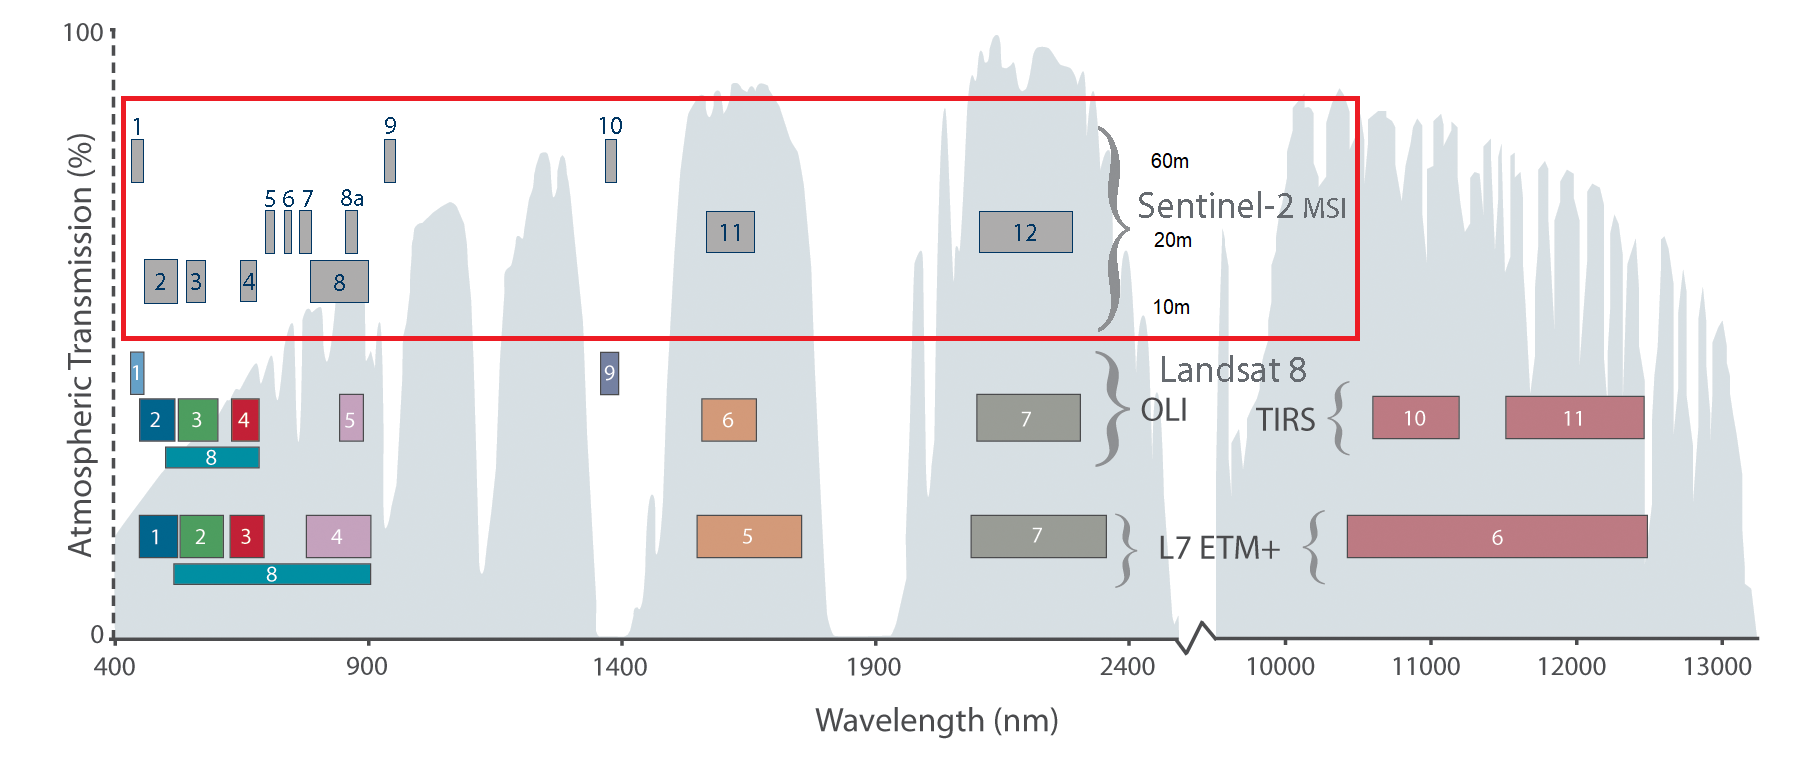
The European Union’s Copernicus program features several Earth observing satellites, including a pair of satellites carrying high resolution optical sensors: Sentinel-2A (S2A) and Sentinel-2B (S2B). The satellites were launched recently, S2A in June 2015, S2B in March 2017. The sensor on board is called Multispectral Imager (MSI). Each satellite overpasses the same place on Earth every ten days. Combined, both satellites yield a revisit time of 5 days, recording with 290 km swath width.
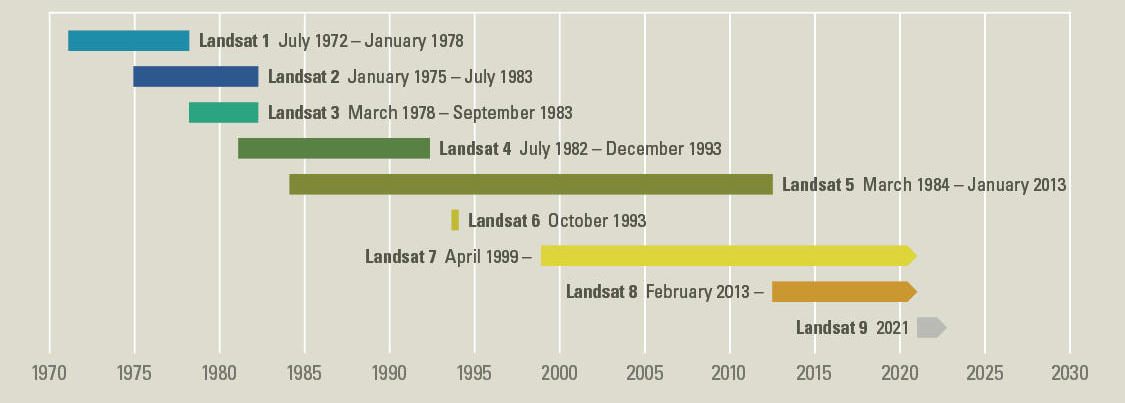
The Landsat mission comprises eight multispectral Earth observing satellites, with Landsat-1 initially launched in 1972. From the launches of Landsat-4 and Landsat-5 Thematic Mapper’s (TM) onwards, the Landsat mission featured at least six key bands in the optical domain at 30m spatial resolution: blue, green, red, nIR, SWIR1 and SWIR2.
The Sentinel-2 MSI has 13 spectral bands, which partly resemble the Landsat spectral bands but also add new spectral regions, such as the red edge bands. The bands have varying spatial resolutions of 10, 20, or 60 m. The three visible bands blue, green, red, and a broad nIR band come at 10 m spatial resolution (bands 2, 3, 4, and 8). Red edge bands, a narrow nIR band, and the swIR bands come at 20 m spatial resolution (bands 5, 6, 7, 8a, 11, and 12).
The Landsat sensor family has a swadth width of ~185 km, a 16-day repeat cycle by one sensor (i.e., 8-day repeat cycle by two sensors), which new missions such as the Sentinel-2 family outperform. However, the continuous long-term archive of 30m Landsat imagery is truly unique and allows for multi-decadal assessments of land surface change on Earth.
Data providers
Image archives such as the Sentinel-2, Landsat or MODIS data catalog represent enormous data volumes, growing larger every day. Who stores the data and how is it made accessible to users?
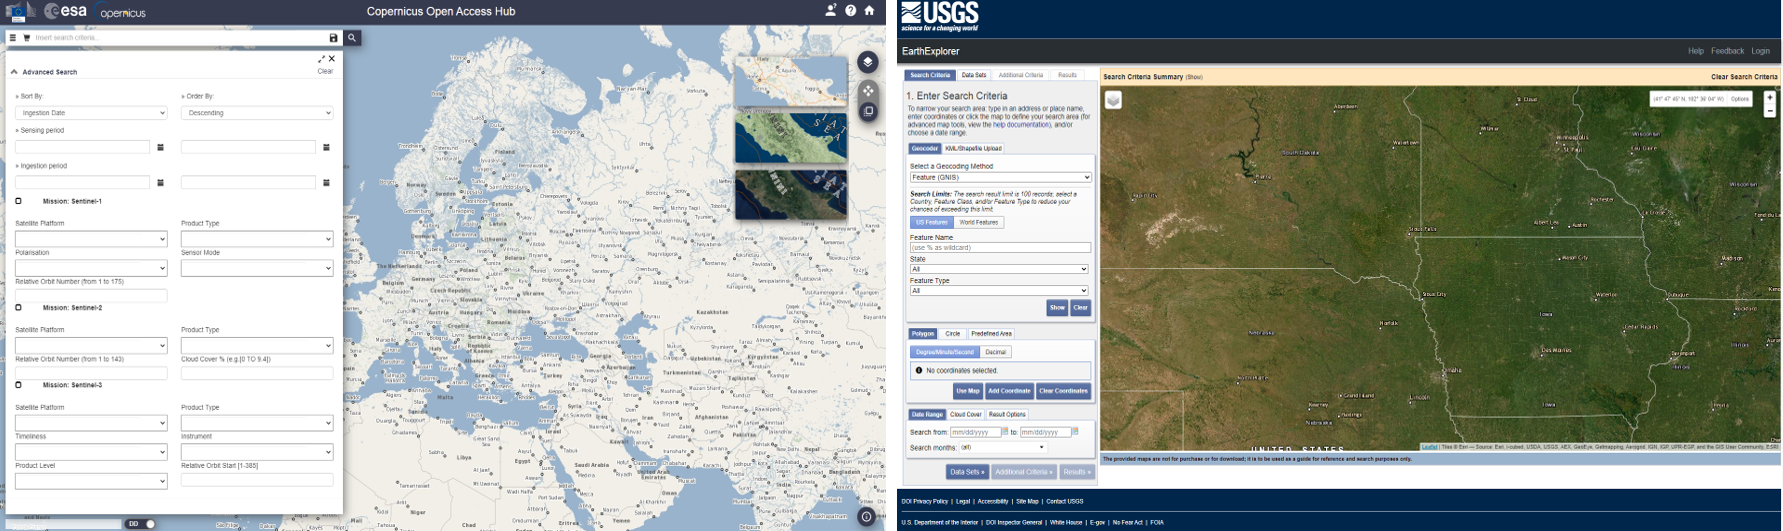
Public institutions such as the the European Space Agency (ESA) and the United States Geological Survey (USGS) play a key role in this regard, as they host the currently most relevant platforms for Earth Observation data distribution - the Copernicus Open Access Hub and the USGS Earth Explorer. Most (but not all) of the data provided on these platforms are currently available free of charge.
-
Zoom to Berlin and then switch to Area Mode:

- Draw a region-of-interest (ROI) to approx. cover the greater Berlin study area from the previous sessions.
-
Open the search bar
 and filter using the following criteria:
- Mission: Sentinel-2
- Product Type: S2MSI2A
- Sensing period: 2019/01/01 to 2019/12/31
-
First save
 ,
then start
,
then start  the
search
the
search
- What are the available product types - specifically: How do S2MSI1C and S2MSI2A differ?
- What determines the spatial footprint of the displayed imagery (i.e. rectangles, overlaps, trapezoid-like shapes)?
- How many images are available for the T33UUU-granule in 2019?
-
Adjust the settings to only include images with
<= 10% cloud cover. How many images are left? - How does the number of scenes compare to available Sentinel-2 data?
- Why could setting a conservative cloud threshold be more restrictive
and unsuitable compared to Sentinel-2? To answer this, you may want to
remove the cloud cover threshold and then take a look at the preview
images by clicking
 for
a selected Landsat scene.
for
a selected Landsat scene.
Sentinel-2 data
Visit the Copernicus Open Access Hub and login or create a user account if you have not registered yet.
Once you are logged-in:You can fine-tune your search using pattern-matching,
i.e. search for specific occurences of characters in the filenames. To
do so, first make sure you saved a search, then load the search (user
profile settings) and edit the text-string that will appear in the
search bar according to your needs: Full text
search. For example, to only search for the specific image-granule
T33UUU, add AND(filename:*T33UUU*) to the search
string.
Landsat data
Accessing Landsat data works in a similar
fashion: Visit the USGS Earth
Explorer. To search for imagery, you will not need an account, only
for downloading the data. Repeat the search with the specified criteria
from above for Landsat-8 Collection 2 Level-2 data.
Copyright © 2023 Humboldt-Universität zu Berlin. Department of Geography.
![]()