- Learning goals
- Google Earth
- Land cover and land use
- Visual image interpretation
- Observing change
- Assignment
1. Visual Image Interpretation
Learning goals
- Understand the basic principles of visual image interpretation
- Explore very high spatial resolution images in Google Earth
- Understand the difference between land cover and land use
- Temporal analysis in Google Earth and Google Earth Timelapse to observe change
Google Earth
Google Earth is a digital globe which displays the Earth’s surface primarily based on mosaics of very high resolution aerial images (after zooming in far enough). Google Earth thus serves as a common entry point to remote sensing and, moreover, opened up the remote sensing technology to the broad public. The desktop application Google Earth Pro offers several features and tools which are useful for visual image interpretation and remote sensing research in general. Among others, these include the availability of various geodata layers (e.g., borders, roads, 3D buildings, etc.) and the possibilities to display historical images, to import both vector and raster geodata, and to digitize objects.
Land cover and land use
The Earth’s surface is a mosaic of various land cover and land use types. Remote sensing based satellite imagery provide synoptic views in space and time and are an ideal source for mapping this diversity. Mapping with remote sensing requires a basic understanding of the difference between land cover and land use.
The terms land cover and land use are often used interchangeably, however, they are distinct from each other. Land cover describes the biophysical composition of the Earth’s surface. Land use describes the anthropogenic use of the Earth’s surface. The differentiation of both terms is crucial in remote sensing as satellites provide imagery of land cover, whereas information on land use is mostly based on additional human interpretation.
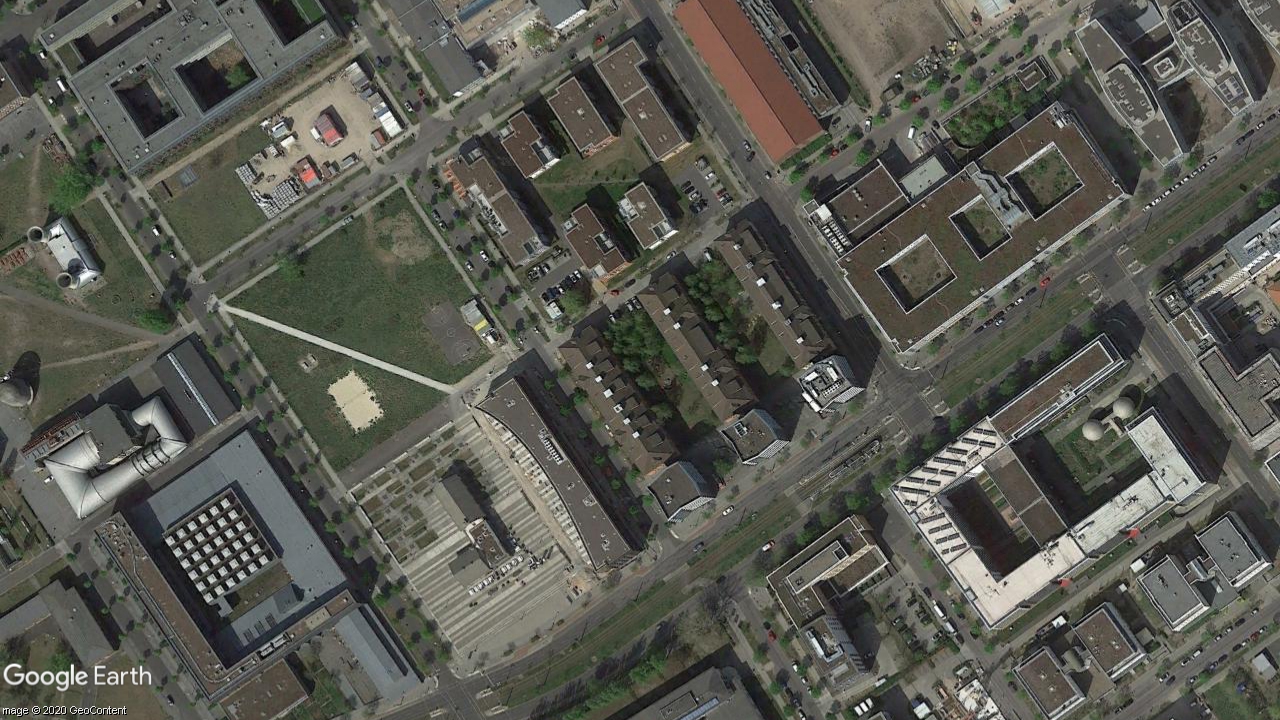
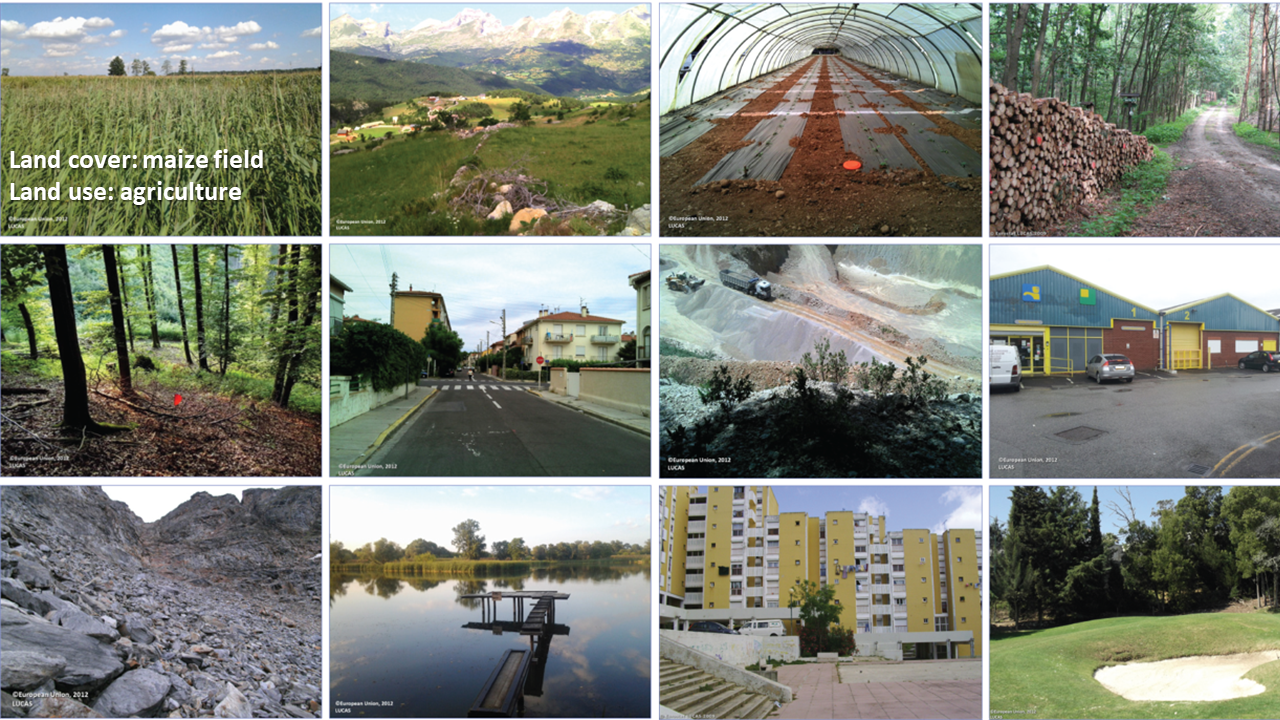
Exercise
The bottom image shows different land cover and
land use classes. Please provide one example for a land cover and land
use class for each image following the example in the top left
corner:
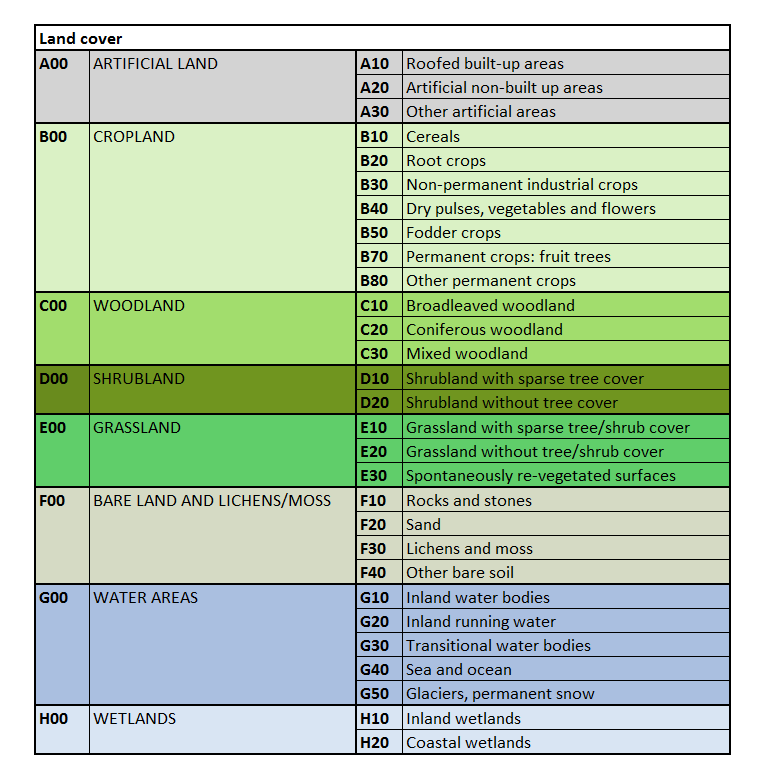
Take a look at the land cover classification scheme down below. It shows land cover categories on two hierarchical levels from the Land Use/Cover Area frame Survey (LUCAS) of the European Union.
Last, let us visit some random places in Google Earth and try to determine the land cover and if possible the use.
Visual image interpretation
The analysis of Earth observation data allows us to draw conclusions about conditions and processes of the Earth’s surface. We often make use of satellite and aerial images taken from spaceborne and, respectively, airborne platforms. Different image properties, such as object features and context, can be used to interpret what is on the ground (e.g., land cover and land use). With the help of images from different dates, we can observe and analyze changes of the Earth’s surface.
The quantity and quality of both satellite and aerial images have enhanced over time. With regard to very high spatial resolution images that are well suited for detailed visual image interpretation, satellite images with a spatial resolution of less than 1 m are available for most parts of the Earth. In urban agglomerations, aerial images often even exceed 10 cm spatial resolution.
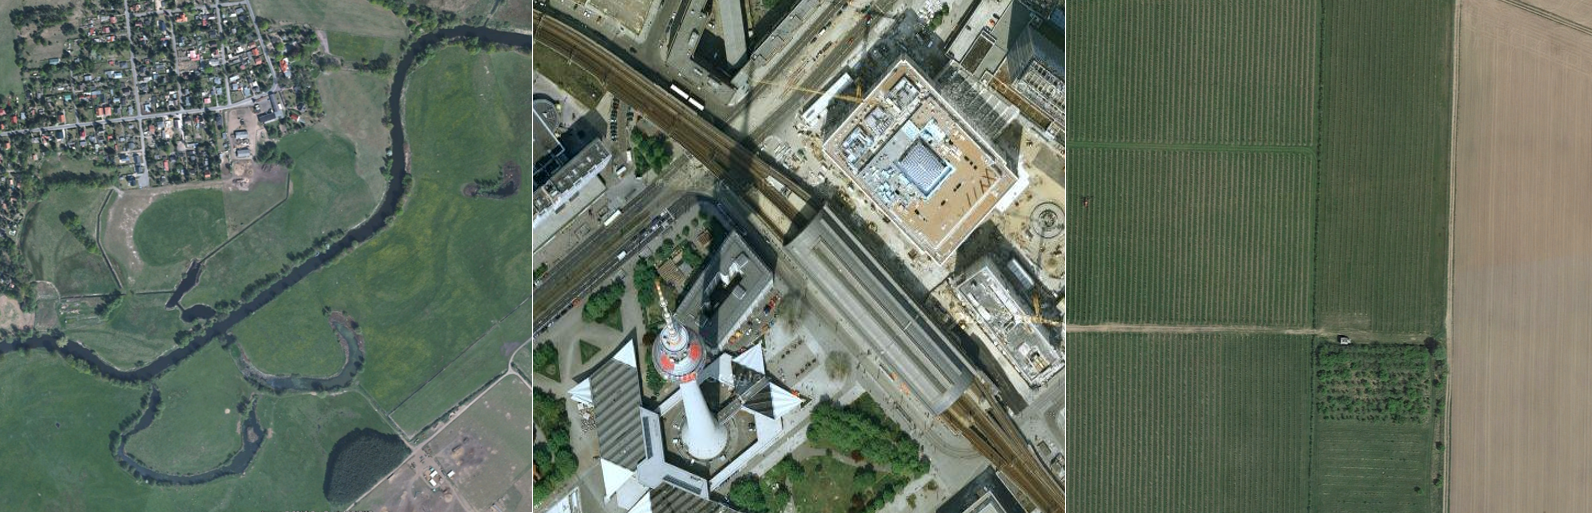
Visual image interpretation implies the human’s ability to analyze the content of images, e.g., land cover and land use from remote sensing imagery. Visual image interpretation encompasses two steps, first the perception of objects according to their external attributes and, second, the actual interpretation of their meaning. The following table provides a guideline for visually interpreting images. The complexity increases as the table progresses starting with the basic elements such as contrast and color and ending with the interpretation of the spatial context:
| Attribute | Description (example) | Interpretation (example) |
|---|---|---|
| Contrast, color, brightness | Transition from light to dark blue | Variations in water depth |
| Geometry (shape, size) | Sinuous ribbon-like object | River |
| Texture (structure of a surface) | Rough surface with vertical line patterns | Maize cultivation |
| Spatial context (functional interrelationship) | Rail tracks that intersect a building | Railway station |
Observing change
- Open Google Earth. Get an overview about the different features and information layers in the upper and left panels. You may want to disable multimedia (e.g. photos) and other layers.
- Zoom to an arbitrary location of interest within Berlin (press “R” to change from oblique view to nadir view). Answer the following questions with help of the very high resolution images:
- Which season of the year was the image captured?
- Is it possible to find out the exact month and/or day?
- What was the time of day?
- How dense is the temporal coverage of available images before and after 2010?
- What major changes can be detected in Adlershof in 2000, 2010 and 2019?
- Describe the differences in image quality in 1953, 2000 and 2019. Why and how do they differ?
Exercise
Let´s start with a practical example of visual
image interpretation by exploring very high resolution imagery of Berlin
using the web version of Google Earth.
Share your insights within the group. Which features of the images allowed you to answer the questions for your locations? Did you notice anything peculiar?
Now let´s look at changes in land cover. Use the Historical Imagery tool (View > Historical Imagery | Cmd+H) to observe older/historical photos of Adlershof and answer the following questions: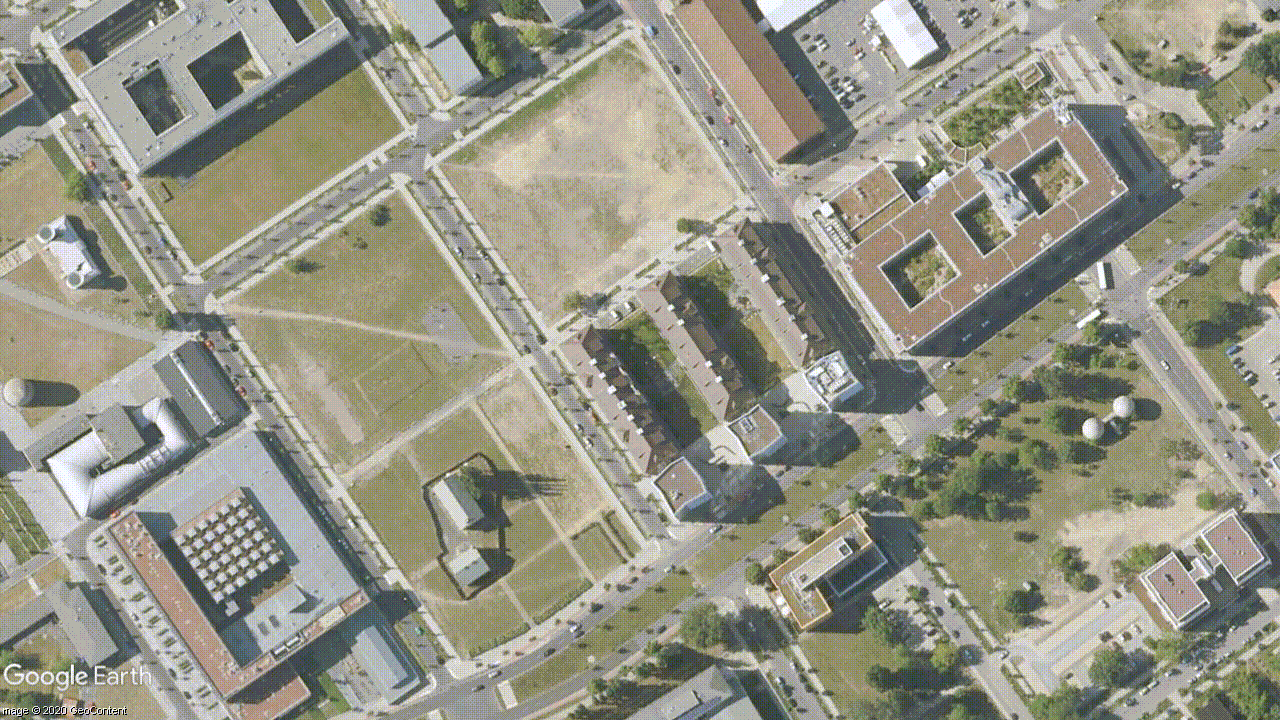
Assignment
The objective of this assignment is to characterize the land cover and land use change in Berlin using Google Earth.
Berlin land cover across space and time
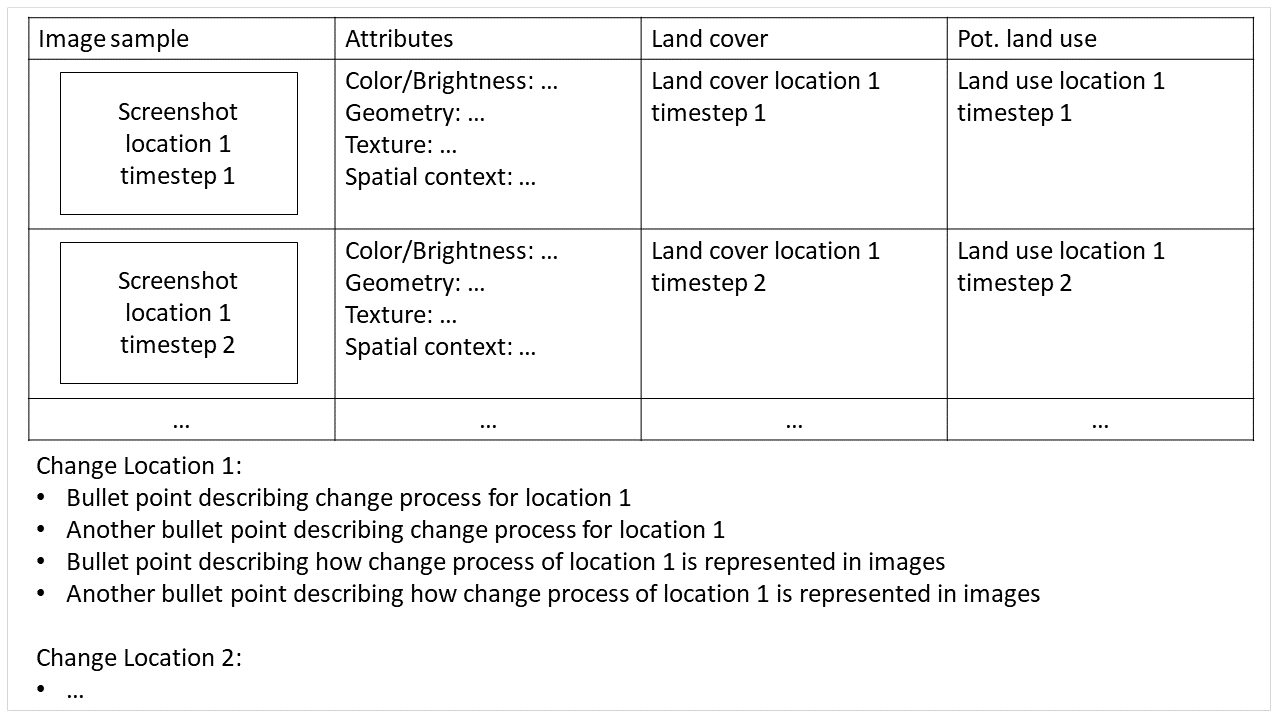
In Google Earth, choose four locations in Berlin that you’re interested in. Find two time steps for each location that show a change process.
- Provide a screenshot of the two timesteps for each of the four locations.
- Visually interpret the images for each timestep and
location:
- Attributes: Briefly summarise the attributes of your chosen changing object. See table from the visual image interpretation section above for attributes (e.g., color, geometry, texture…).
- Land cover: Make use of the LUCAS scheme from above to define the land cover of the specific area/object within your location
- Land use: If possible, try to define the land use. If it is not possible, why?
- How is the change process expressed visually?
- For each change location, can you determine which attribute changes most srikingly (e.g. colour, geometry, …)?
- Imagine you had a map that classified your area according to the first level of the LUCAS scheme (i.e., artificial land, cropland, grassland, …). Would your change process be visible from such a map?
Submission
Document your answers to the above questions using screenshots, bullet points and a table in PowerPoint, Word or another software package. Please use the following layout suggestion:
Upload your documentation as a PDF file on Moodle.
General submission notes: Submission deadline for the weekly assignment is always the following Monday at 10am. Please use the naming convention indicating session number and family name of all students in the respective team, e.g. ‘s01_surname1_surname2_surname3_surname4.pdf’. Each team member has to upload the assignment individually. Provide single file submissions, in case you have to submit multiple files, create a *.zip archive.
Copyright © 2023 Humboldt-Universität zu Berlin. Department of Geography.
![]()