- Background
- Learning goals
- Optical remote sensing
- Reflectance of photosynthetic active vegetation
- Radiance & reflectance
- Lab spectroscopy
- Assignment
- Assignment data
- Process & plot data
- Interpret plots
- Submission
4. Spectral properties I - Laboratory
Background
Learning goals
- Recap the basic principles of optical remote sensing
- Recap reflectance of photosynthetic active vegetation
- From radiance to reflectance
- Learn how to measure with the ASD FieldSpec
- Analyze lab spectroscopy measurements
-
This session you will work in small groups in the spectral lab of the
geographic institute. A supervisor will be present, however you are
encouraged to work independently. You will have a sheet with
instructions that are printed out and given to you in the lab.
Please read the instructions carefully at home before you start
the work in the laboratory. You can find the PDF file here.
Optical remote sensing
Optical remote sensing makes use of the radiation reflected by a surface in the visible (~400-700 nm), the near infrared (700-1300 nm) and shortwave infrared (1300-~3000 nm) parts of the electromagnetic spectrum. Spaceborne-/airborne-based remote sensing and field spectroscopy utilize the solar radiation as an illumination source. Lab spectroscopy utilizes a lamp as an artificial illumination source.
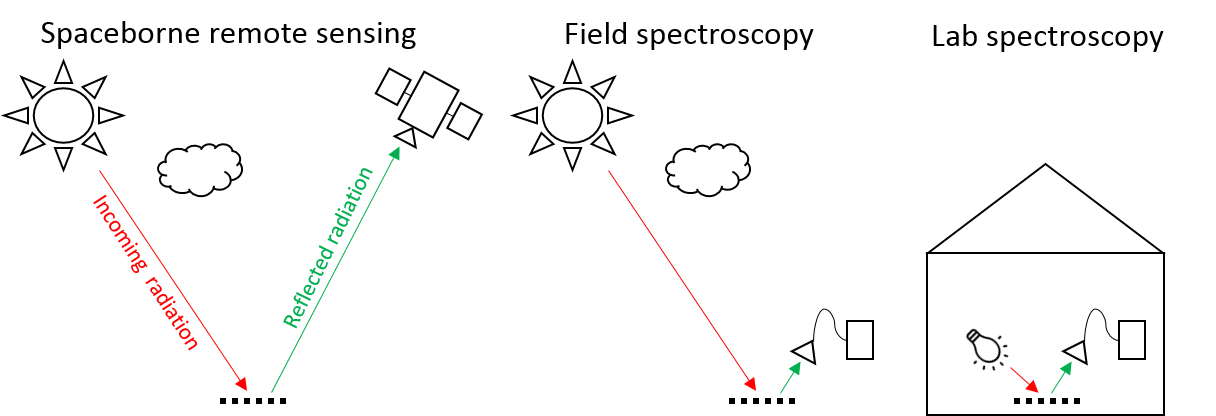
The proportion of the radiation reflected by a surface depends on the surface’s spectral reflection, absorption and transmission properties and varies with wavelength. These spectral properties in turn depend on the surface’s physical and chemical constituents. Measuring the reflected radiation hence allows us to draw conclusions on a surface’s characteristic, which is the basic principle behind optical remote sensing.

Reflectance of photosynthetic active vegetation
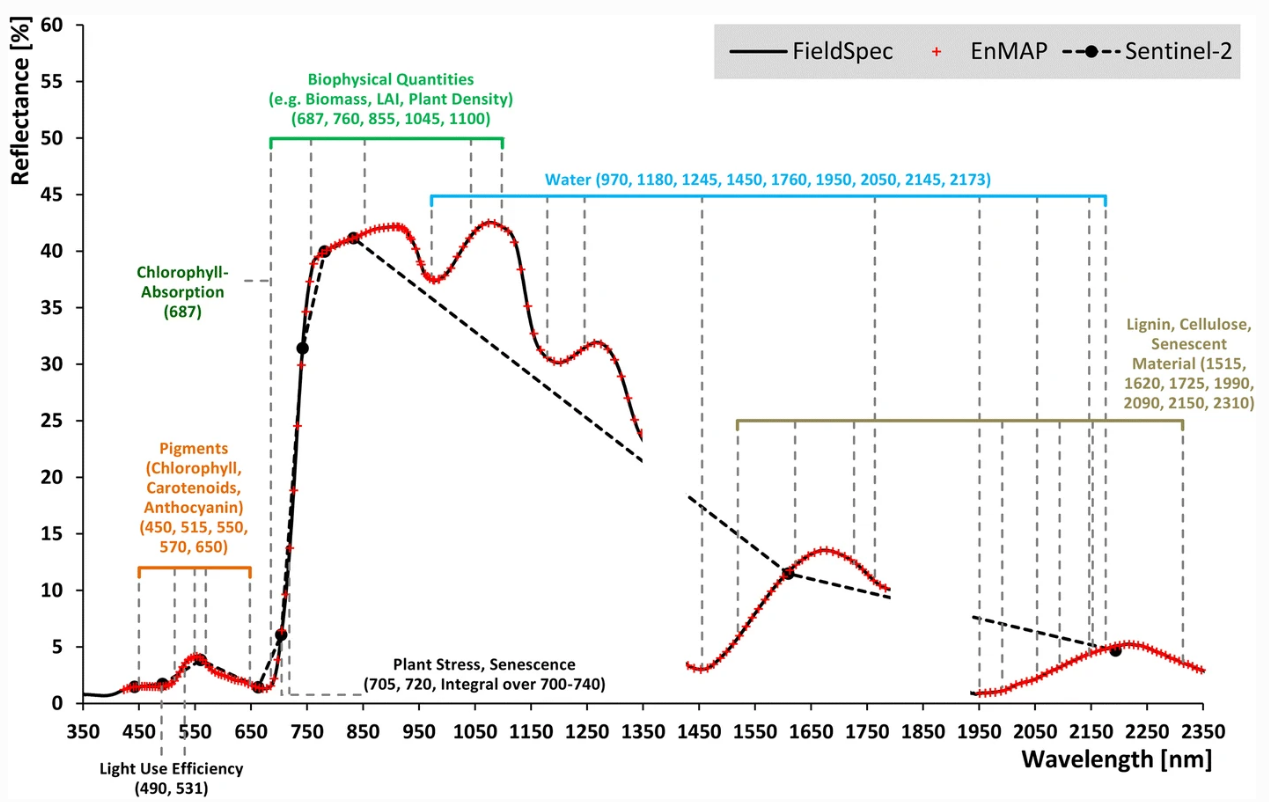
Vegetation produces a distinct spectral reflectance pattern due to its leaf and cell structure, its physiognomy, and complex stand structure. As you can see in the image below, the reflectance of photosynthetic active vegetation is strongly influenced by its physical properties. Leaf pigments alter the reflectance in the visible part of the electromagnetic spectrum, the cell structure changes reflectance behaviour in the near-infrared and water content impacts reflectance in the shortwave-infrared. In the laboratory, we will explore how photosynthetically inactive vegetation differs from active ones across different wavelength regions.
Radiance & reflectance
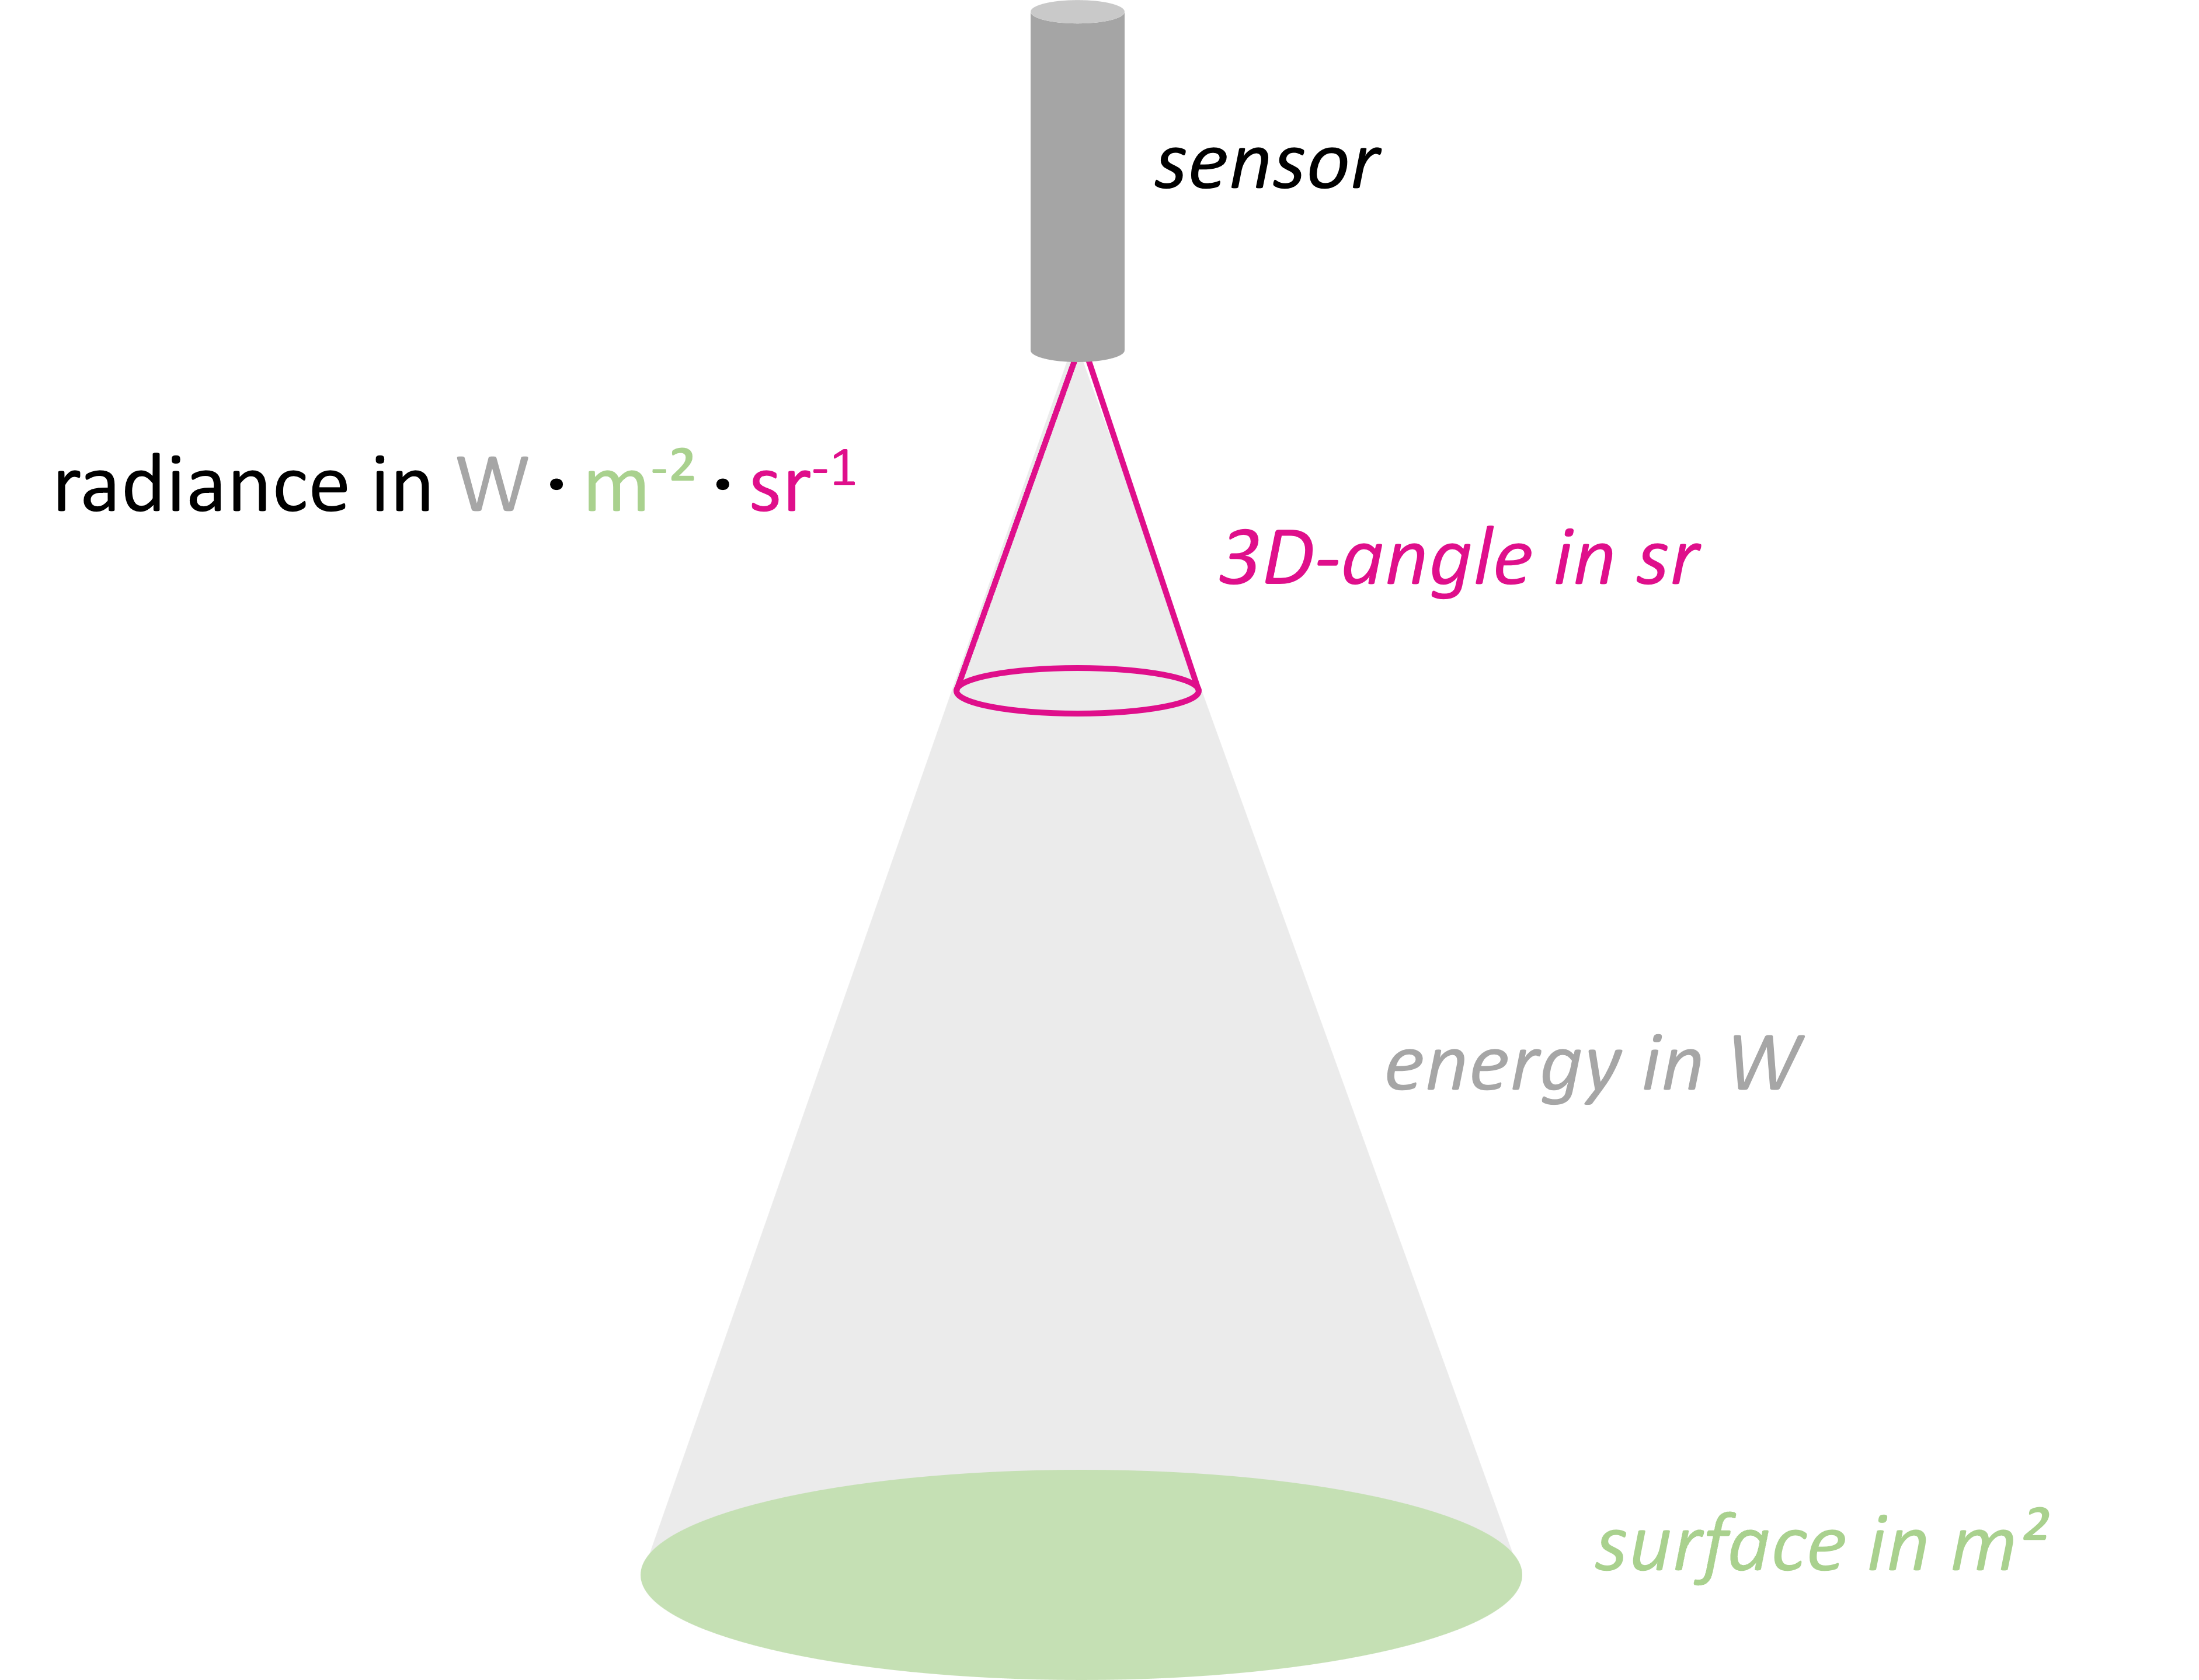
Optical sensors/spectrometers measure the radiation reflected by a surface to a certain solid angle in the physical quantity radiance. The unit of radiance is watts per square meter per steradian (W • m-2 • sr-1).

In other
words, W • m-2 • sr-1 describes the amount of
energy (W) that is reflected from a surface (m-2) and arrives
at the sensor in a three-dimensional angle (sr-1).
A general problem related to the use of radiance as unit of measurement is the variation of radiance values with illumination. For example, the absolute incoming solar radiation varies over the course of the day as a function of the relative position between sun and surface and so does the absolute amount of radiance measured. We can only compare measurements taken a few hours apart or on different dates when we are putting the measured radiance in relation to the incoming illumination.
The quotient between measured reflected radiance and measured incoming radiance (Radiancereflected / Radianceincoming) is called reflectance. Reflectance provides a stable unit of measurement which is independent from illumination and is the percentage of the total measurable radiation, which has not been absorbed or transmitted.
A white reference is a surface with a reflectance property of nearly 100% across the visible, near infrared and shortwave infrared part of the electromagnetic spectrum. Accordingly, a radiance measurement of a white reference is the same as the measurement of incoming radiance. White reference measurements therefore serve for calculating the reflectance of a target surface. A typical material used as a white reference is spectralon. Spectralon is well suited due to its Lambertian reflectance characteristics, i.e., radiation is reflected from any incident illumination into all viewing directions equally.

Lab spectroscopy
Lab spectroscopy carried out with a non-imaging spectrometer allows us to exactly characterize the spectral properties of a surface. General advantages of lab spectroscopy are measurements under controlled conditions, e.g. a constant illumination source, flexible determination of distance and angle to the surface, instrument calibration to eliminate the noise from the signal, and no atmospheric influence.
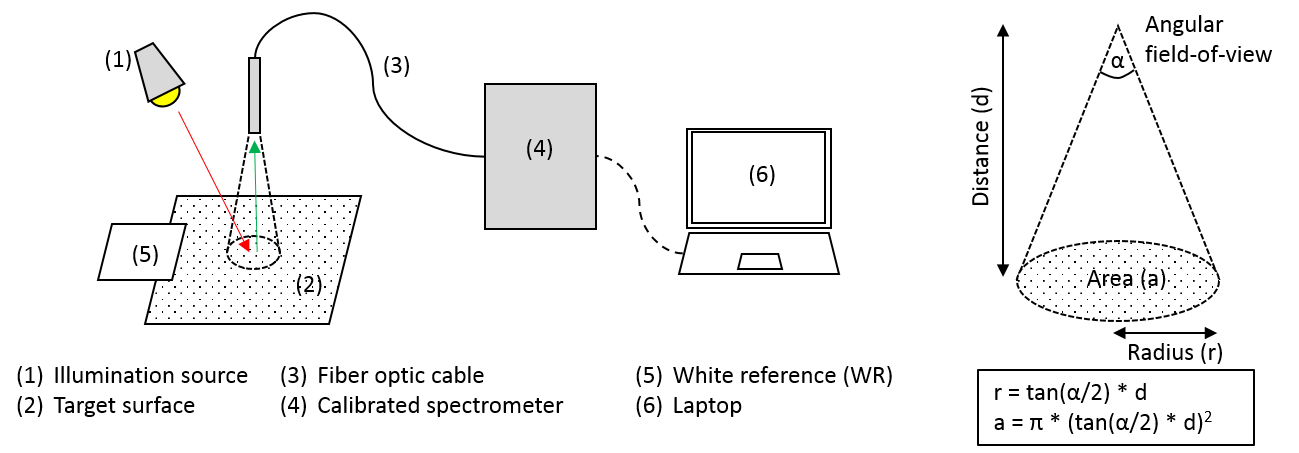

To calculate how large the area is that is measured by the sensor, we can follow the formula in the image above on the right. First, we divide the aperture angle of the sensor in half to create a right-angle triangle. We know the distance between our area and the sensor. Following the theorem of Pythagoras, we can calculate the radius of the area by multiplying the distance with the tangent of the halved aperture angle. Now that we know the radius, we can calculate the area with π * r2.
-
What is the ground area spotted by a spectrometer with an angular
field-of-view of 25° when measuring with a distance of 0.5 m between the
fiber optics and the surface?
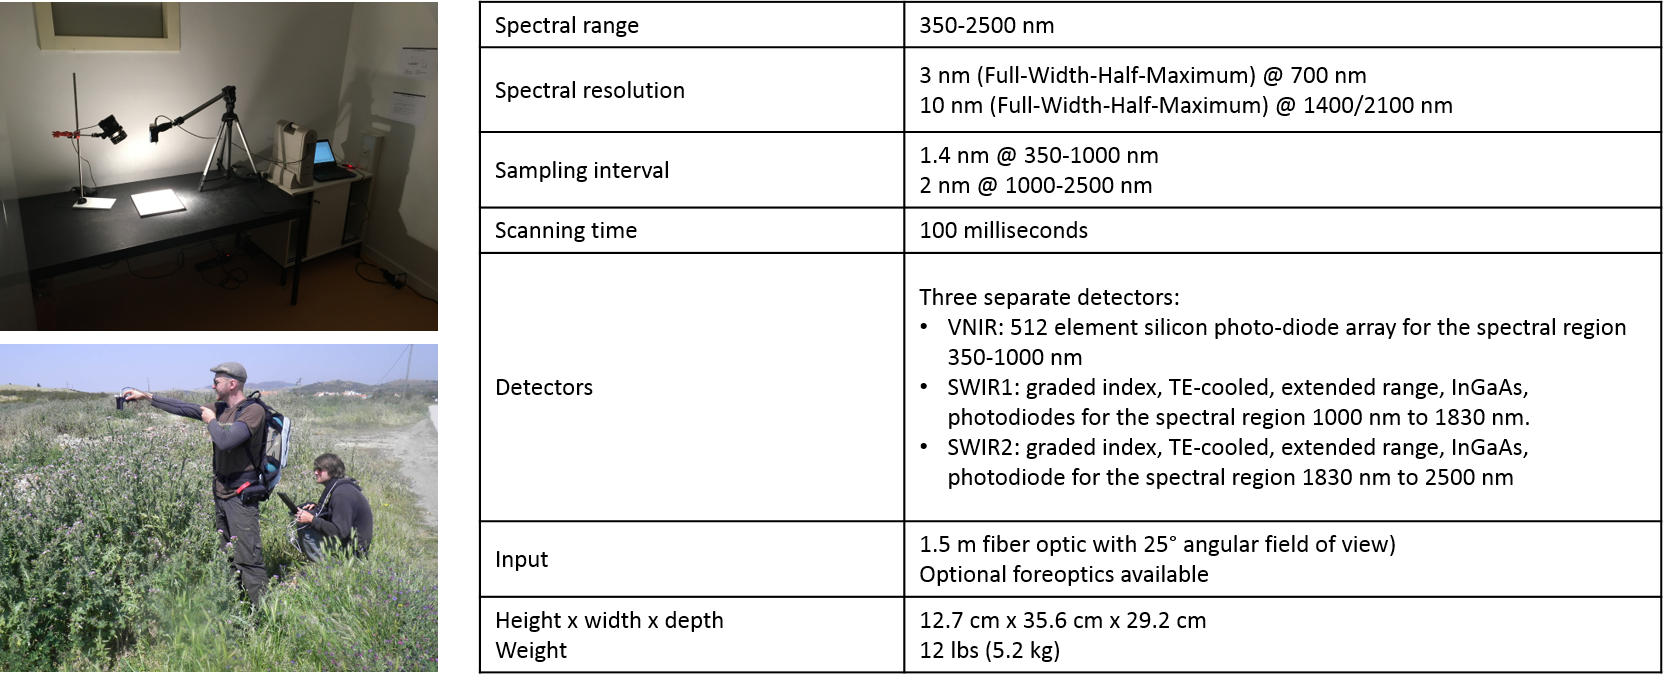
The Analytical Spectral Device (ASD) FieldSpec is a portable non-imaging spectrometer widely used in remote sensing research. The ASD FieldSpec allows both radiance and reflectance measurements in narrow contiguous spectral bands covering the visible, near infrared and shortwave infrared regions of the electromagnetic spectrum. The ASD FieldSpec is specifically designed for field surveys, however, can be also used in the laboratory.
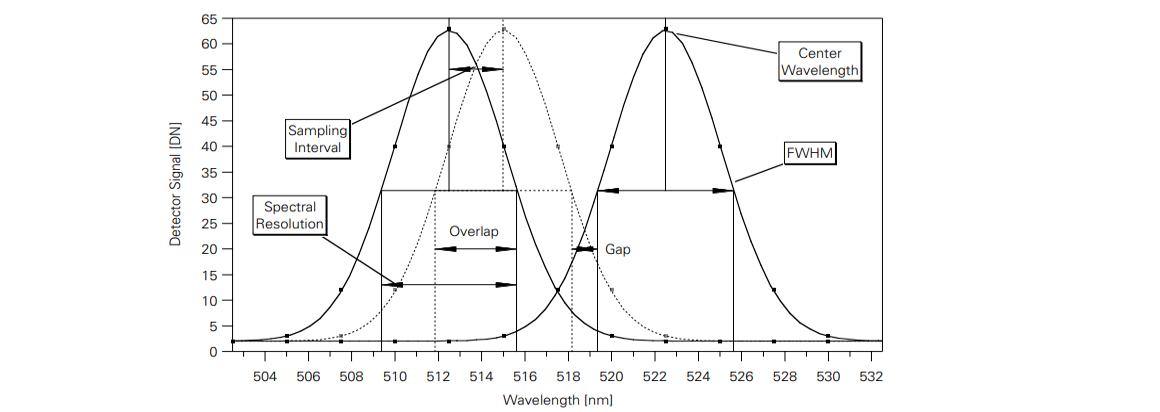
This seminar session utilizes the ASD FieldSpec 3. This device has separate detectors for the visible and near-infrared VNIR (350-1000nm) and the short-wave infrared SWIR1 (1000-1800nm) and SWIR2 (1800-2500nm) to measure the reflected radiance in 2151 bands. The measurement of each band can be described with a Gaussian response function, where the spectral resolution is the Full-Width-Half-Maximum (FWHM) and the spectral sampling interval is the distance between neighboring bands. The spectral resolution of the ASD FieldSpec 3 is 3 nm in the shorter and 10 nm in the longer wavelengths. Spectral sampling interval is 1.4 nm at 350 to 1000 nm and 2 nm at 100 to 2000 nm.
Please watch this short video (includes sound), which gives you an idea of what you are going to do in the laboratory:
Assignment
The aim of this assignment is to conduct several spectral measurements of different surfaces under laboratory conditions and to process and visualize the recorded spectra. Your measurements will be provided in radiances in a comma-separated text file (‘Labormessungen_group1.txt’) after your work in the lab.
Assignment data
Proceed with the laboratory data. As described in the lab measurement video, the data sets contain multiple radiance measurements of a red tile, a white reference, a piece of asphalt, and reflectance measurements of tree leaves of different vitality.
| BaseName | Description |
|---|---|
| meas.000 | First radiance measurement of the white reference |
| meas.001-003 | Radiance measurement of the red roof tile |
| meas.004 | Second radiance measurement of the white reference |
| meas.005-007 | Reflectance measurements of asphalt |
| meas.008-010 | Reflectance measurements of green leaves |
| meas.011-013 | Reflectance measurements of yellow leaves |
| meas.014-016 | Reflectance measurements of dry leaves |
Process & plot data
Process the laboratory data set to provide the following diagrams:
- Diagram 1: Illustrates the 5 radiance measurements (meas.000-004).
- Diagram 2: Illustrates the 3 radiance measurements (001-003) processed into reflectance. Use the mean of the two white reference measurements to calculate reflectance.
- Diagram 3: Illustrates the reflectance measurements of asphalt and vegetation (005-016).
- Diagram 4: Illustrates 3 reflectance spectra of different vitality states of the leaves. To do so, calculate the mean reflectance spectra for each vitality state.
Note: Style each diagram properly, i.e. add a plot title, format
axes, add axis title including units, add legend, etc. For calculating
the mean of reflectance per wavelength have a look at the function
rowMeans() using ?rowMeans or
help(rowMeans).
Carry out the calculations and plotting in R. The code snippet below shows how to import the data and visualize it in R.
Example: Reflectance calculation and plotting with R
# Introduction to Remote Sensing Winter 2024/25
# Humboldt-Universität zu Berlin

# R script to convert measured radiance into reflectance

# Read measurements from online resource. Alternatively provide full file path to asd_exercise.txt;
# use your own data here
msr <- read.table('https://box.hu-berlin.de/f/86adf0e907c44da9a7b8/?dl=1', sep=',', dec='.', header=T)

# Calculate reflectance
msr$vegetation.reflectance <- msr$vegetation.radiance / msr$whitereference.radiance

# Create line plot of wavelength (x-axis) and reflectance (y-axis)
plot(x=msr$wavelength.nm, y=msr$vegetation.reflectance,
     type='l', ylab='Reflectance', xlab='Wavelength (nm)')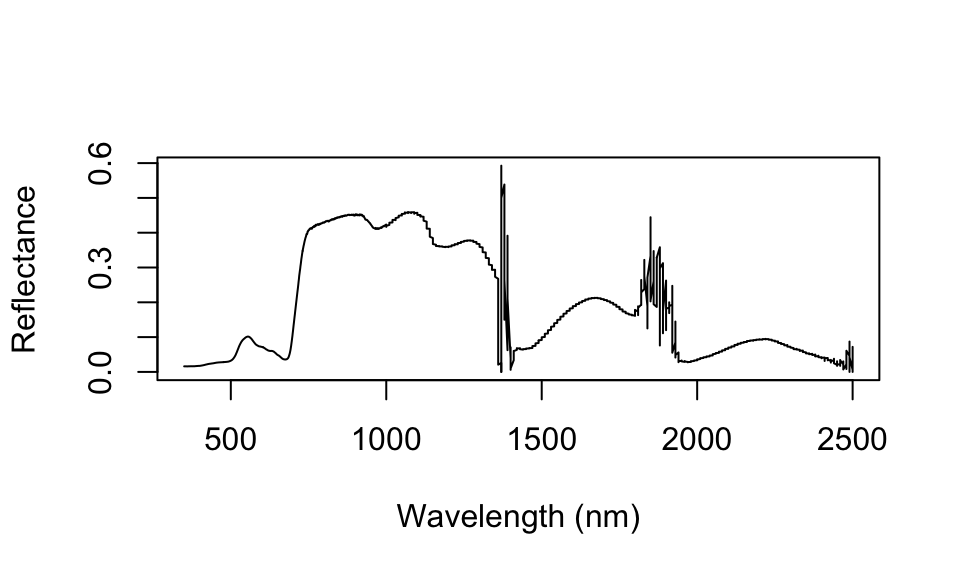
Interpret plots
Interpret the plots you’ve created. Answer the following questions:
- Diagram 1: What are the main differences between the radiance of the spectralon and the radiance of the roof tile?
- Diagram 2: Compare your calculated reflectance with the measured radiance in Diagram 1. Why do the reflectance graphs look different compared to the radiance graphs?
- Diagram 3+4: Which wavelength regions seem to be characteristic for distinguishing asphalt and vegetation with different vitality stages? Interpret what physical properties might be the cause for higher reflectances or absorptions in the different wavelength regions. The image of the vegetation spectrum and its characteristic spectral features in the “Reflectance of photosynthetic active vegetation” section might be helpful.
Submission
Upload the diagrams and your answers to the questions above as a PDF file on Moodle.
General submission notes: Submission deadline for the weekly assignment is always the following Monday at 10am. Please use the naming convention indicating session number and family name of all students in the respective team, e.g. ‘s01_surname1_surname2_surname3_surname4.pdf’. Each team member has to upload the assignment individually. Provide single file submissions, in case you have to submit multiple files, create a *.zip archive.
Copyright © 2023 Humboldt-Universität zu Berlin. Department of Geography.