- Procedure
Motivation
The Berlin Senate is preparing Berlin for the challenges of the future in terms of urban planning, climate change, and sustainability. To accomplish this ambitious goal a vast number of tasks in a wide range of disciplines have to be tackled. One such is the evaluation of the current condition of green spaces within the city as those play a complex role in many aspects of urban life.
One of the most crucial aspects is the much needed groundwater recharge made possible by unsealed and uncompacted ground in green areas. This is of growing importance as Berlin’s groundwater storage continues to decline. Besides known benefits of healthy vegetation like carbon capture and air quality improvement another important aspect is its ability to provide cooling effects. Supporting this naturally occurring cooling effect of well managed green areas is a crucial part of climate regulation and climate change adaptation.
Knowledge about the current status and trend of past years is essential to further allow for informed decision making by city officials.
Quantification of Urban Green Areas of Berlin via
Remote Sensing
Sustainable management and urban green areas - the city of Berlin aims to strengthen the connection between the two domains - moving closer to the “city of the future”. You could make a vital contribution in this undertaking!
Your mission is to quantify urban green within the city of Berlin. A central role in this project will be the data processing of remote sensing data and the main objective the creation of a final map product that includes areas beyond public ownership.
Your tasks will include- preparation and processing data
- classification of recent urban green areas and sealed areas
- if feasible, quantification of change in urban green and sealed areas since ca. 1990
- degree in a relevant field related to the job posting (Geography, Geoinformatics, Urban and regional Planning, Ecology and Environmental Planning, Geosciences, or comparable fields)
- basic knowledge of data processing in R
- basic knowledge of data processing in QGIS
- understanding the significance of green, water and sealed settlement areas for the urban climate
Does this spark interest? Then don’t hesitate to get in touch. We are looking forward to your application.
Procedure
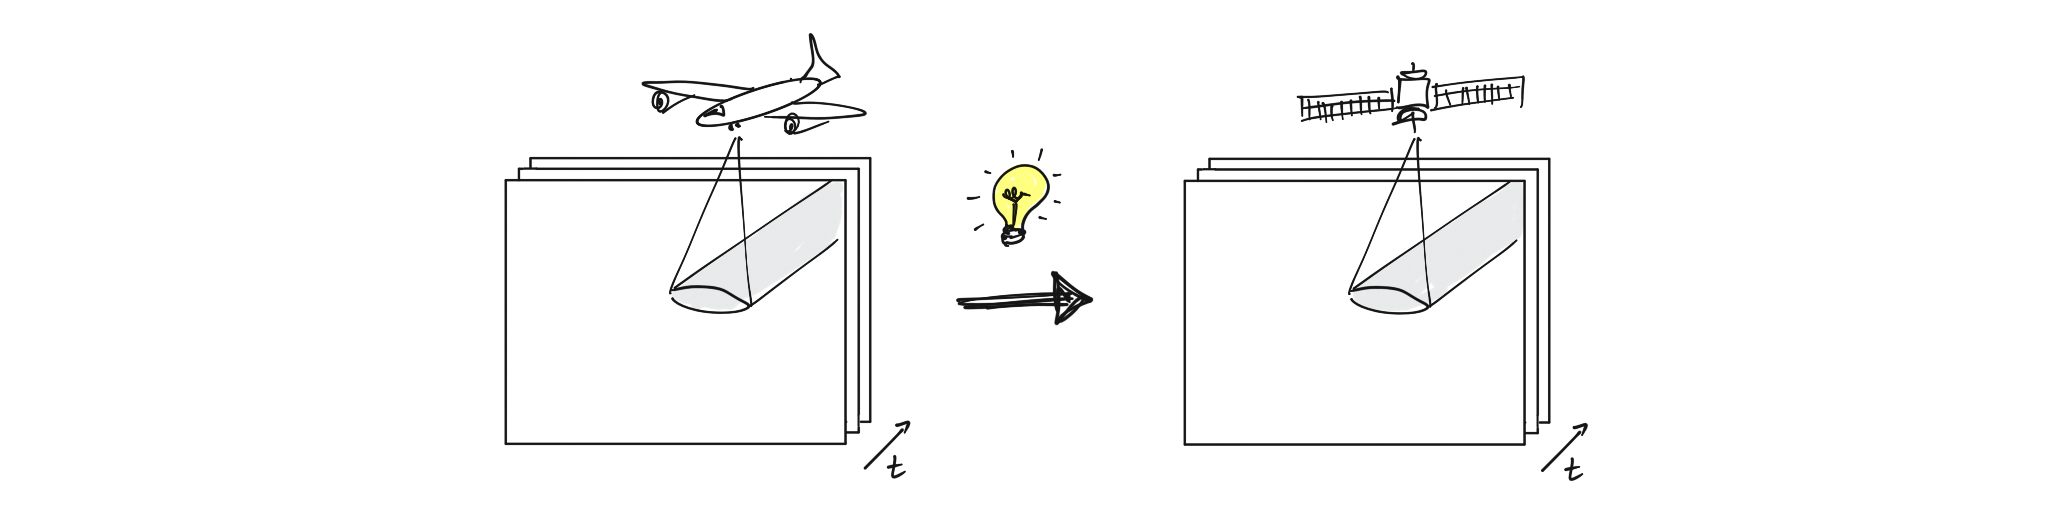
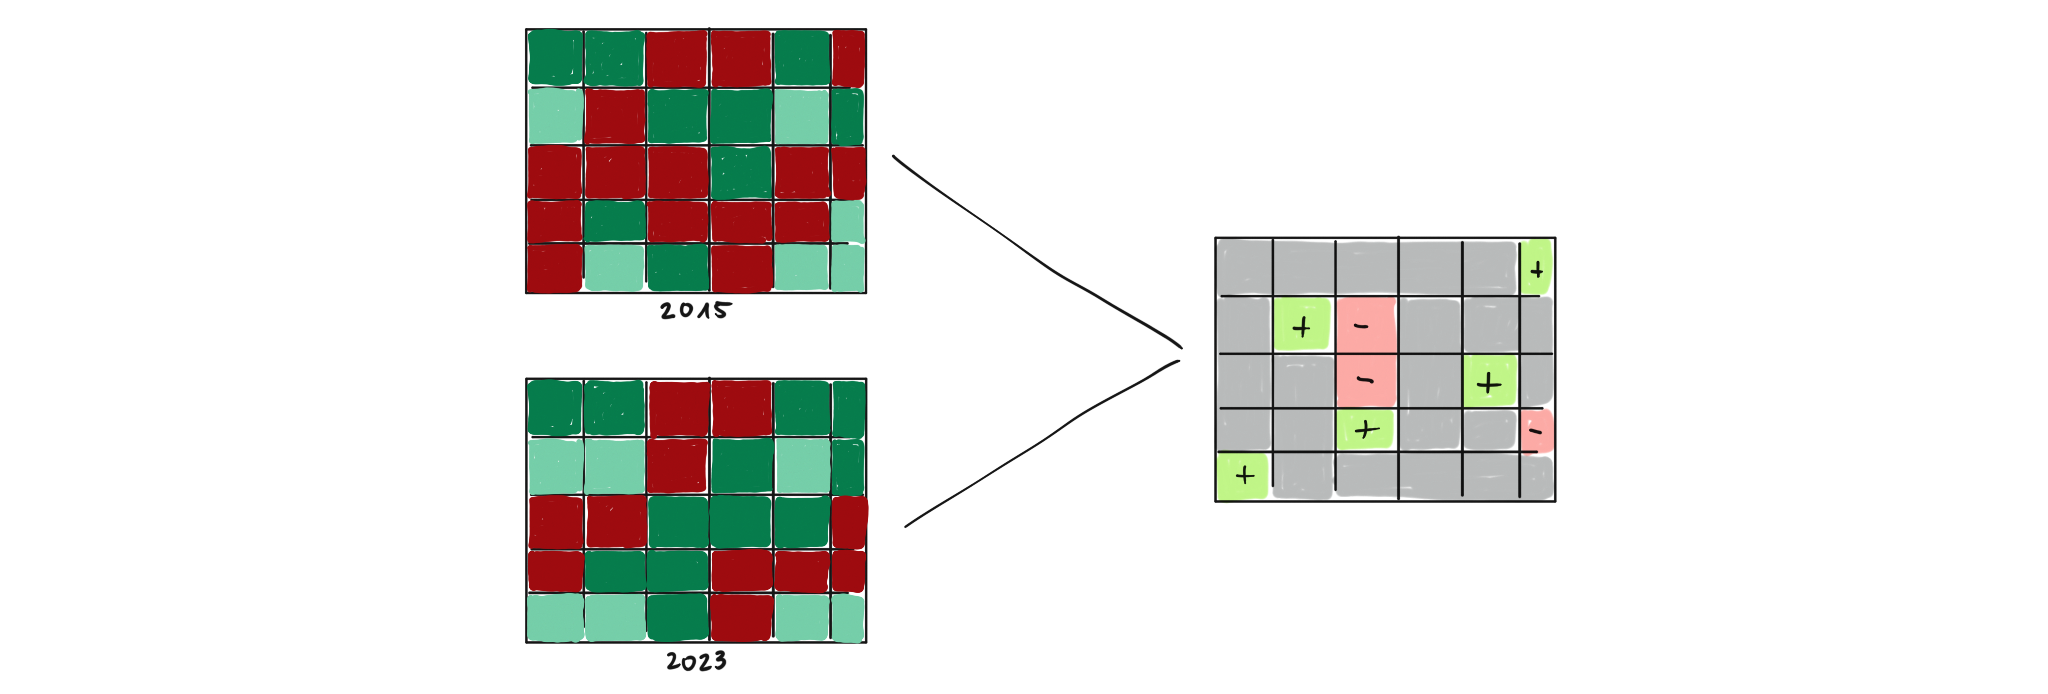
The Berlin Senate requires a map depicting the change of Berlin’s urban green spaces and sealed surfaces. There are several steps necessary to fulfill the Senate’s request: First, we need to decide what data we want to use. Because we ultimately want to map change in urban green, we cannot simply use any land cover product of Berlin. The advantage of satellite data is that we can go back in time and have a consistent time series of images available for our analysis. For example, the Landsat archive provides consistent optical imagery since the mid-1980s (and inconsistent even since the 1970s). In order to map change in land cover, we first have to map land cover of Berlin at fixed points in time. We will not download satellite data in the course, but people interested in how to get data for free by yourselves can have a look at the self-study seminar session for data acquisition
Before we start to create a land cover map, we first have to understand what information satellite images hold and how to interpret and extract the information necessary for our analysis. To get a feeling for what change looks like from above, we first take a look at recent and historical airborne images of Berlin (Session 1). After that, we get familiar with satellite data and learn how to visualize and interpret images that contain information beyond the perception of our eyes (Session 2). Because we will use more than one satellite image for the Senate’s request, we will have a look at the unique metadata of different images. Furthermore, we will learn to process raster data using R. This will allow flexible and efficient processing of remotely sensed imagery (Session 3).
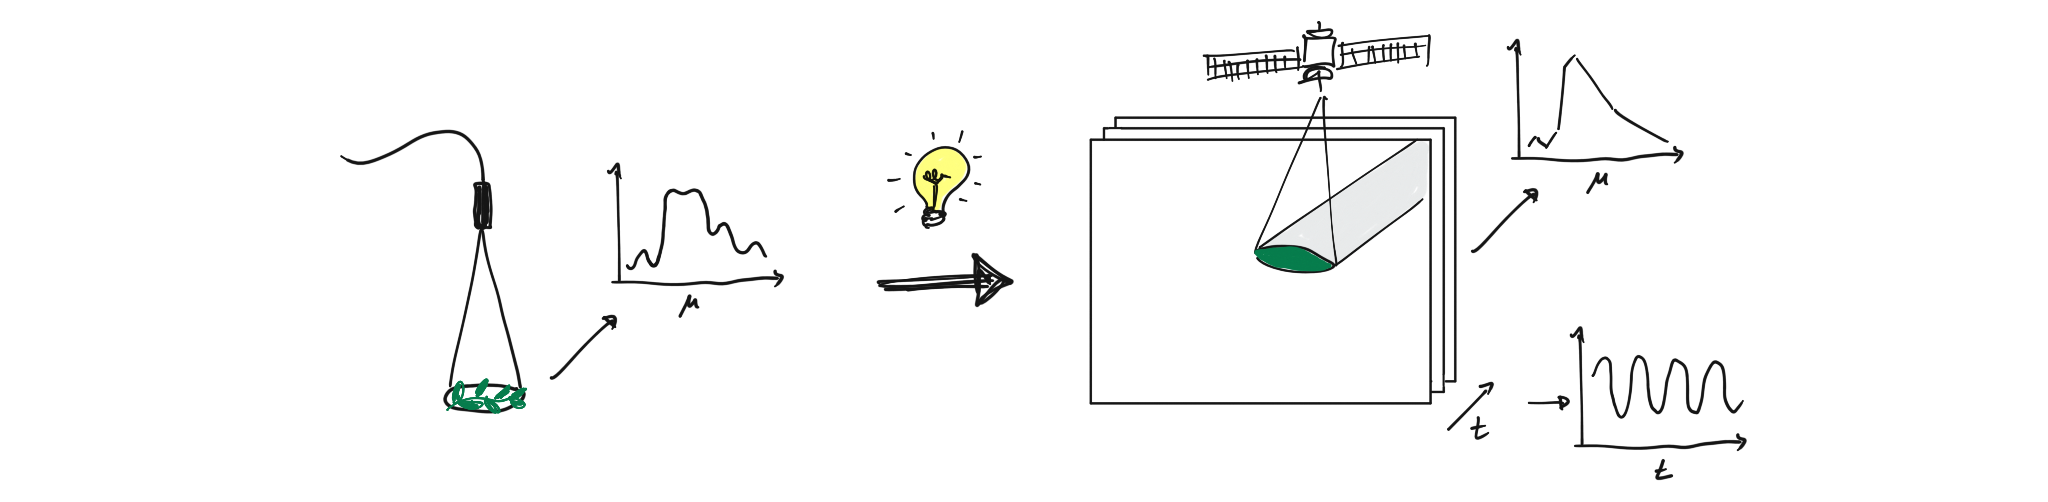
Now that we understand how to handle satellite data, we will learn how to derive the thematic information necessary for our classifications. As we want to map the change of vegetation and built-up area in Berlin, we will measure different vegetation and built-up types under laboratory conditions with a spectroscope (a measurement device that measures the light spectrum that is reflected from a surface) and get familiar with their distinct reflection spectra (Session 4). After that, we will translate what we learned in the laboratory to satellite images and see how different land cover types behave when measured from space (Session 5). Now that we know the spectral characteristics of different land cover types, we will learn how to condense the spectral information given by a variety of measurements for different wavelength regions into one measurement that is easier to interpret. We will learn how to calculate vegetation indices to better distinguish between different vegetation types and between vegetation and non-vegetation. As vegetation in Berlin varies seasonally, we will also start working with images from multiple time steps and learn how using images from different time steps improves our understanding of what is on the ground (Session 6).
After we learned how vegetation and built-up area can be distinguished theoretically, we finally start applying our knowledge by classifying a map. We will start with a manual classification where we will define classification rules based on the insights of the last sessions (Session 7). We will soon realize that a manual classification is tedious, especially if several land cover classes are involved and we want to classify multiple images. Thus, we will get to know a machine learning algorithm that automatically classifies images when given training data (Session 8).
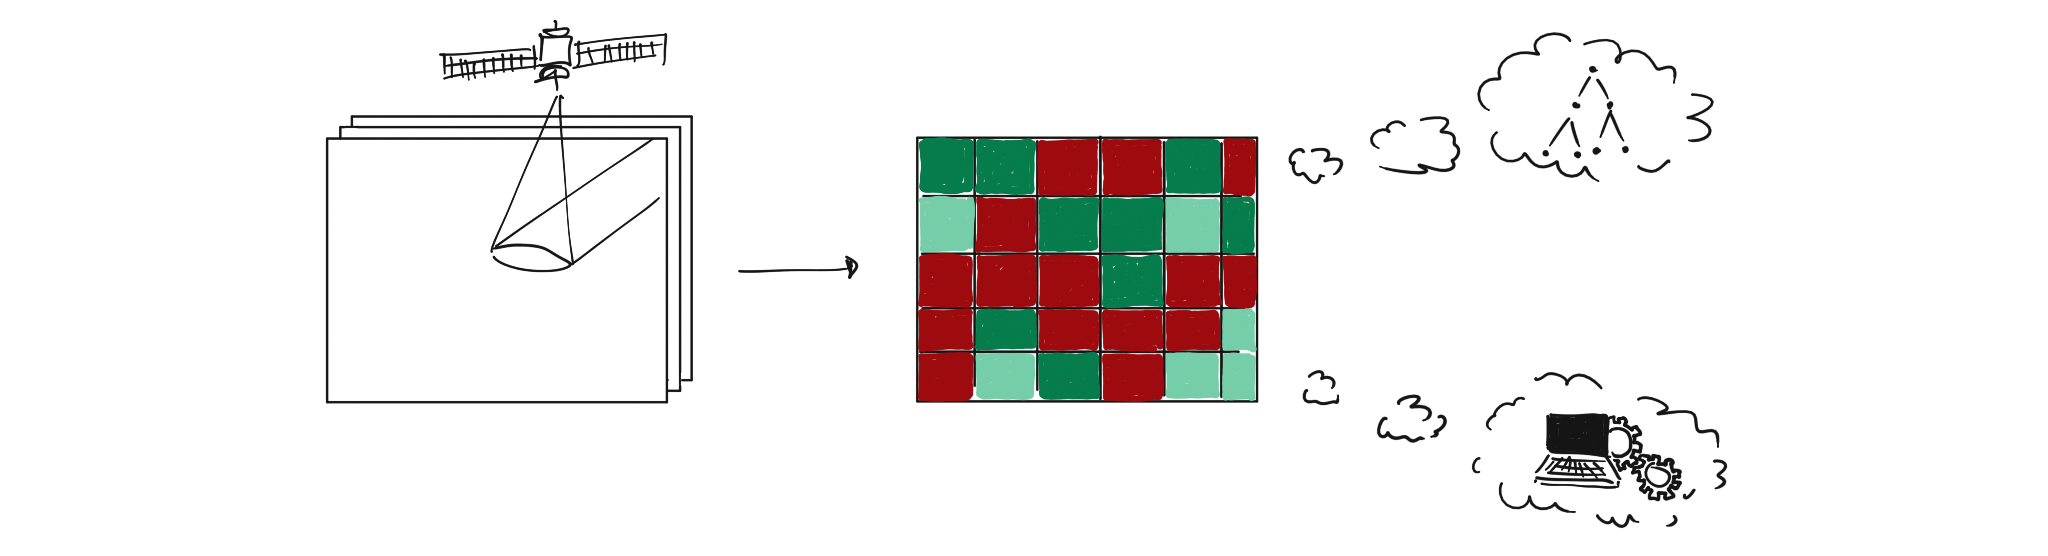
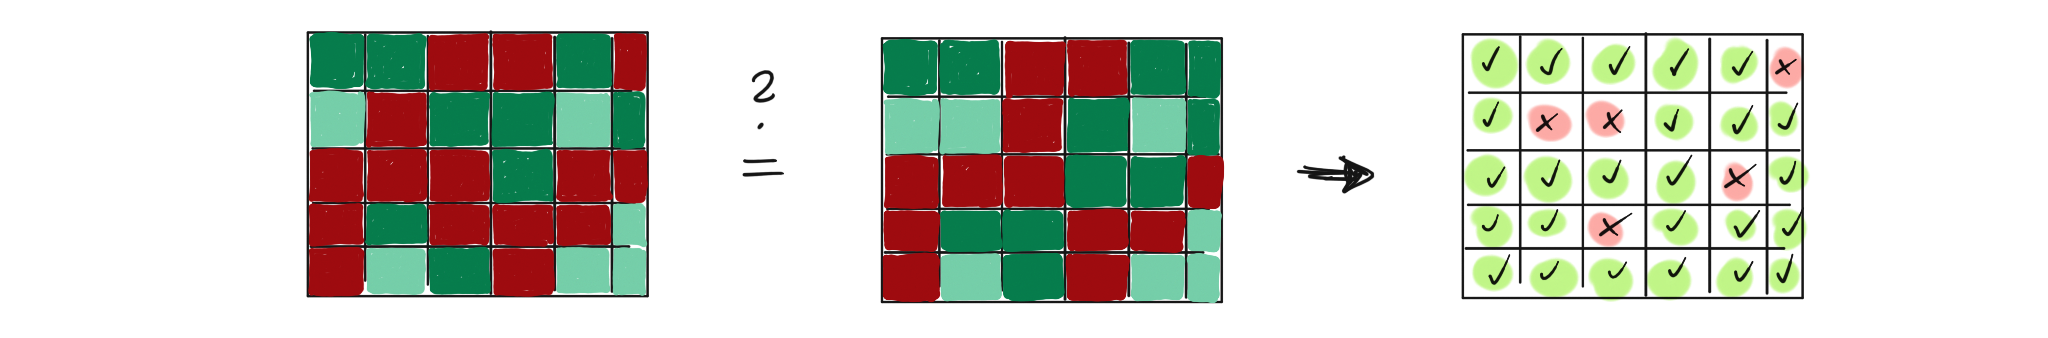
Once we have created a land cover map of Berlin, we also need to report to the Senate how well our maps depict reality (or ground truth). In other words: How accurate are our results? Therefore, we will learn how to conduct an accuracy assessment and how to interpret its results (Session 9).
Once we have our workflow of data processing, manipulation and land cover mapping, we can look into the request of the Berlin Senate to assess change in land cover. We will learn how to create a change map based on classifications from different steps in time (Session 10).
During the seminar we will guide you through the steps that were outlined above. At the end of the course, you will have acquired the knowledge to process remote sensing data for answering a wide array of questions related to processes on our planet’s surface, whether your interests lie with melting ice sheets, urban sprawl, desertification, or land use science.
Copyright © 2023 Humboldt-Universität zu Berlin. Department of Geography.
![]()